
Stereology, as a mathematic tool, deals with the interpretation of bidimensional images to extract information about the tridimensional structures they come from. Such a description could be mistaken with projective geometry or tomography, what means some more detail on stereology is needed. In stereology, the bidimensional images that are analyzed are transversal sections, not necessarily parallel to each other, of the tridimensional structure subjected to study.
Despite the origin of this mathematic branch is site on the 17th century, its real development started on the late 19th century and it wasn’t named until 1961, when the term “stereology” was created and the International Society of Stereology was founded. This means it is a relatively young and unknown discipline, but with a high applicability in all the fields of science involving the analysis of macroscopic and microscopic images, from neurology to geology.
The relation with metallography, the study of the internal structure of the materials based on the microscopic observation of their polished sections, is clear. For example, the reference international standards, such as ASTM E112 “Standard Test Methods for Determining Average Grain Size”, employ stereology to define the same measuring and interpretation rules all around the world.
We will use a simple case to introduce the application of stereology to metallurgy, taking ferritic ductile iron as the working material. The structure of this material is formed by a ferrite matrix, where graphite spheroids are dispersed (Figure 1). The characteristics of this dispersion, mainly the number, size and shape of the spheroids, give very valuable information to the metallurgist. From these characteristics, it is possible to assess the foundry practice and yield predictions on the behavior of the material in service. These evaluations are based in the inspection of metallographic sections.
 | |||
| Figure 1. a) Representation of a ductile iron volume; b) Representation of a metallographic cut (red plane) and intersection with the graphite spheres; c) Real metallographic section of a ductile iron (graphite in red). |
Since the measurements are made on 2D metallographic section, the real value of the parameters of interest is not measured actually. Sketching the problem helps visualizing it easily (Figure 2). For example, imagine you need to measure the real diameter of the graphite spheroids in a sample. You will prepare a metallographic surface that will intersect a set of spheroids, each one through a plane that will not coincide exactly with the center of the spheroids and, thus, the observed graphite diameters will always be smaller than their actual size. The distribution of the 2D diameters will be the variable that will allow predicting, thanks to stereology, our parameter of interest: the real diameter of the spheroids.
 | ||
| Figure 2. Example of three graphite spheres with an identical diameter D that are cut by the same plane (red line) at different distances from their centers, leading to circles of diameter d1, d2 and d3. |
As an introductory example to stereology, we will take an ideal case in which all the graphite particles are perfect spheres of the same diameter D. We will deduct the relation between this diameter D, that can’t be measured directly, and the di diameters, measured on the microscope by means of metallographic techniques. A few basic tools in geometry, probability and integral calculus will be needed.
The relation between the 3D diameter D and the 2D diameters di depends upon the distance x from the center of the sphere to the metallographic cutting plane. From the Pythagorean theorem (Figure 3): . Or in a more convenient form .
 | |
| Figure 3. Relation between the position of the cutting plane x, the real sphere diameter D and the diameter di of the circle observed in the cutting section given by the red line. |
The distance x can take values from 0 to D/2 and all the possible cutting plane positions are equally probable. In consequence, x is a random variable following an uniform distribution and its probability density function is f=2/D between x=0 and x=D/2 (Figure 4). So, despite all spheres having the same diameter, the circles observed at the microscope will be different to each other.
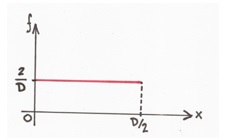 |
| Figura 4. Función de densidad de probabilidad aplicada en el ejemplo. |
The average value of the diameters di can be obtained combining the previous equations and integrating

This allows obtaining the real diameter D of the 3D graphite spheres, in function of the arithmetic average of the diameter di measured on 2D micrographs.
A simplified stereological analysis case as the one presented here can be resolved in a few lines, but the as the models get closer to the real world, the problem get more and more complex. A basic tool for the metallurgical activity of IK4-Azterlan that through advanced image analysis and other in-house developed techniques based on stereology is able to make a rigorous and accurate metallurgical characterization of different alloys and production technologies.
Hoping you have enjoyed this exercise, we bid you farewell until our next post on maths for metallurgy.
No hay comentarios:
Publicar un comentario